
1. The problem at stake
Why do learning technologies remain underexploited despite more than 100 meta-analyses (Borokhovski et al., 2022) showing positive effects on learning? In their second-order meta-analysis, Tamim et al. (2011) report a mean effect size of 0.35 favoring technologies. We come back later to this overgeneralization: talking about the effects of technology in general. However, even when researchers restrict generalization to a specific tool, findings often fail to replicate at scale, with exceptions such as CMU's tutors (Aleven et al., 2009). Replicability is bound to generalizability, i.e., whether empirical results collected in some contexts generalize to 'similar' contexts (Stephens, 1982). Maybe because digital technologies are concrete objects, often a movable box, our community mistakenly believed that implementing technology across contexts would be easier than implementing complex policies such as inclusive education (Fitz et al., 1994).
Generalization principles primarily concern sampling study participants rather than sampling contexts. Meta-analyses nonetheless model context through 'moderating' variables such as learning content (e.g., STEM), learner age, SES profile, class size, etc. This set of variables defines the scope of generalizability, but any context comprises an infinite number of variables since it refers to an infinite number of circles (the class, the school, the education system, the country, ...). This contribution concerns the immediate context surrounding learning activities, the classroom, which constitutes the actionable peel of the contextual onion. Here, 'classroom' refers to the traditional rectangular space typically equipped with a board, tables, and chairs. What follows does not apply to virtual classrooms, museums, informal or workplace training.
This paper analyzes the replicability leak using several concepts centered on the classroom. Consider two classrooms: A, where evidence has been elaborated, and B, where it fails to replicate. Classrooms A and B, despite being similar on main variables (learner age, content, class size,...), often differ in unnoticed elements: micro-constraints in classroom routines are inadvertently waived when running a classroom experiment and often reappear when technology is scaled up. We describe as 'classroom-blind' technologies tools that do not enable B's teacher to adjust A's technology to B's micro-constraints. In addition, because classrooms A and B don't have the same teacher, if B does not reach the same results as A, the teacher in B is often blamed for lower acceptance (TAM) or knowledge (TPACK). Instead, we argue that designers should design more orchestrable technologies. 'Classroom orchestration' (Dillenbourg, 2013) is often treated as synonymous with 'classroom management', but the term was coined to convey two ideas. The first is integrating individual, team, and class-wide activities within a lesson, some computer-based and some not. This point was developed in response to the tendency to view collaborative learning and individual work or lectures as mutually exclusive practices. The second flavor acknowledges classroom micro-constraints, or the 'logistics' of schooling, which the literature often neglects, and explains some scalability pitfalls.
Beyond contextual differences, replicability requires generalizing the causal link between the intervention and its effects on learning outcomes. Technology does not produce learning outcomes; Richard Clark wrote this in 1983. Outcomes result from the learner's cognitive and emotional processes while performing activities with technology. Causality is indirect: technology affordances (hereafter TA) create opportunities to trigger cognitive activities (CA), which generate learning outcomes (LO). Outcomes depend on these activities, not on technology. Designers focus on the left part (TA->CA) of Figure 1: technology affordances potentially trigger activities (Antonenko et al., 2017). The right part -activities produce learning (CA->LO)- belongs to learning sciences. The myth of intrinsic effects of learning technologies is the mistaken belief in a direct causality from TA to LO. We'll later reformulate this myth as the SITE syndrome.
Figure 1. Technology does not generate learning outcomes; it may trigger cognitive activities that produce outcomes.

2. Tackling the myth: experiment 1
This study took place within the Swiss Vocational Education and Training (VET) system, which is apprenticeship-based. Apprentices typically spend four days a week working in a company and one day at school. The first study focuses on logistics apprentices, who move and store goods in a warehouse. They are meant to learn logistics, such as optimizing storage and flow of goods, although warehouse organization typically falls under their manager's responsibility. Teachers reported that logistics is a complex, abstract subject for these students with limited educational backgrounds. To make learning more tangible, we co-designed an AR tabletop simulation with teachers (Figure 2, left). Teams of 3-4 learners create a warehouse mock-up by arranging small plastic shelves on a table. The AR displays the flow of goods and forklift movements, simulating warehouse operations and performance (Zufferey et al., 2009).
Figure 2: The tangible AR interface (left), an orchestration card (right)
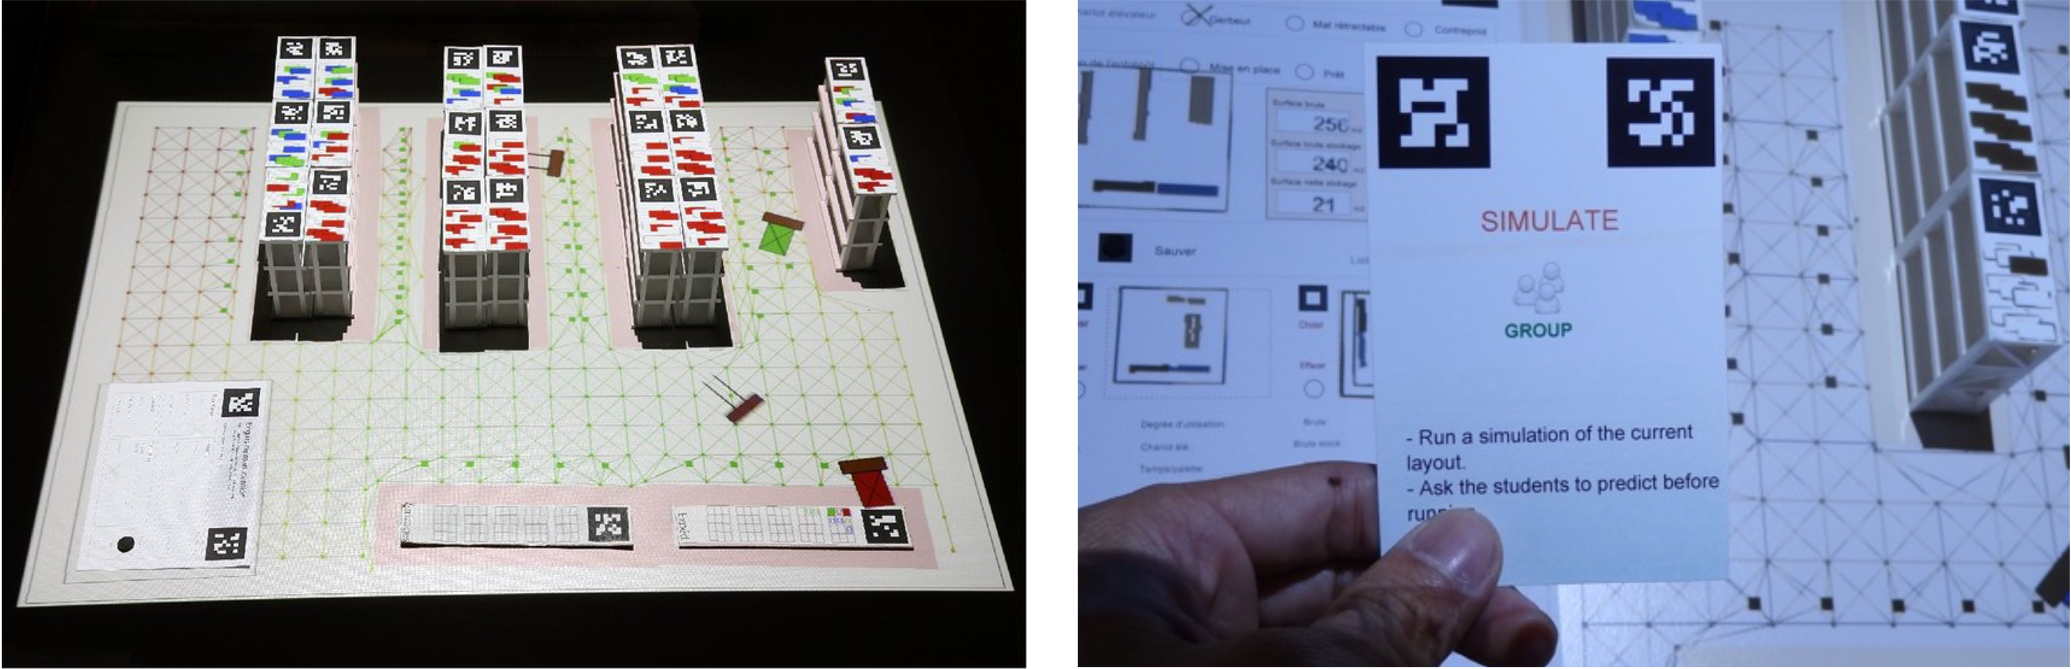
Both learners and teachers responded very positively to the environment, with the teachers highlighting that it allowed them to explain abstract principles concretely. However, the experiment's results were disappointing: apprentices using the system did not outperform those practicing similar activities with paper in either declarative knowledge or problem-solving skills. A qualitative analysis revealed that the key difference between the low and high performers was the frequency of reflective discussions (Do-Lenh et al., 2012). Low performers tended to tinker, repeatedly moving shelves and running the simulation without analyzing their performance or predicting outcomes, a well-known pitfall in learning from simulations (Jong & Joolingen, 1998). We hence designed paper cards to empower the teacher in 'forcing' teams to make hypotheses (Figure 2, right). The teacher showed the card to the system to lock the simulation. To unlock it, teams had to predict whether the new warehouse design would outperform the previous one and to explain why. Once satisfied with their responses, the teacher showed the other side of this 'orchestration card' to unlock the system. Predicting, even when incorrect, is a demanding cognitive activity. We also provided teachers with more tools for classroom orchestration (section 9). In a subsequent study using these tools, the same AR activities produced significantly higher learning gains than paper-based activities. The first experiment highlighted the unpredictable nature of the TA-CA relationship. In the second study, the paper cards enabled the teacher to obtain CA, thereby mediating the TA-CA-LO chain (Figure 3). The tangible interface offered several affordances (TA): enabling quick and intuitive manipulations and avoiding screen interference with social interactions. The targeted cognitive activities (CA) included hypothesis formation, experiment design, and observation interpretation.
Figure 3. The teacher's role in the causal chain

This study challenges the myth of intrinsic technological effects. While the technology remained unchanged for learners, empowering teachers to force predictions shifted learning outcomes from non-significant to significant. How can a technology be deemed effective if its impact depends on the teacher's role? Most colleagues would agree that the teacher's role is crucial. However, using technology as the only independent variable implicitly betrays our belief that the system will have effects independent of the teacher's role.
3. One blames teachers; who blames developers?
"Do teachers matter?" is the provocative title of studies that measure the influence of teachers on students' school achievement (Slater et al., 2011). The results tend to indicate that teachers' impact depends largely on how learner achievement is measured (Guarino et al., 2015). While the experiment in logistics showed the importance of the teacher role, many policymakers would appreciate assurance that a tool produces similar effects with any teacher, excellent or weaker. I even heard a CSCL colleague proudly stating, "I have no teacher effect": research methods treat these effects as methodological biases because they weaken the causal link between technology and outcomes. Assigning the same teachers to both the control and experimental groups neutralizes the teacher's effect, but introduces another bias: teachers' (lack of) enthusiasm for the tool. No double-blind study exists in education.
The learning technology literature (this is less true in CSCL) rarely describes how teachers should act when learners use technology; instead, it often points to teacher features that explain the low scalability of experimental results. The first feature is the technology acceptance model (TAM) (Scherer et al., 2019). I do not question its impact on scalability, but I argue that it captures only half the equation. Teachers' acceptability of a technology depends not only on their willingness to accept it but also on how acceptable the technology is. Classroom usability (section 8) is so poor for some tools that TAM should be replaced by FAM, the 'Frustration Acceptance Model'. 'Classroom-blind technologies' complicate classroom orchestration. Who could be blamed for not accepting tools that make one's profession more difficult?
The second teacher feature is Technical Pedagogical Content Knowledge (TPACK) (Mishra & Koehler, 2006). My favorite example of TPACK is 'dynamic geometry' (Laborde & Laborde, 2008) which articulates elements of geometry (content), guided discovery (pedagogy), and direct manipulation (technology): by moving continuously (drag and drop) the vertices of geometric figures, learners may discriminate features that are intrinsic properties of the geometric construction since they remain constant despite the displacement of the vertices. If teacher training improves TPACK (Ning et al., 2022), does it lead to better learner outcomes? Akturk & Ozturk (2019) found that teachers' self-assessed TPACK levels account for 12% of students' final grades in Turkish secondary schools. I have no doubt that future users' TPACK partly predicts success at scale, but, as with TAM, I argue it captures only half the equation: the ability to use a tool effectively depends not only on the teacher's knowledge but also on the technology design.
Comparing these two logistic experiments confirms that the disappointing results of the first study were not due to teachers having low TAM or TPACK, as the same teachers participated in the second study. Instead, the AR tool was so playful that teachers struggled to attract students' attention. The orchestration card helped them to require deeper cognitive engagement from their apprentices. Rather than blaming insufficient TPACK, we provided cards that lowered TPACK requirements for classroom orchestration.
4. Classroom micro-constraints reduce generalizability
Despite the positive outcomes of the logistics experiment, this AR tool did not achieve large-scale adoption or become part of long-term practice. Few schools in Switzerland teach logistics, and other countries rejected the AR device as too expensive. However, even the schools that had acquired the tool stopped using it a few years later. The technology required teachers to come earlier to install these bulky devices, set up electrical extension cords, and sometimes recalibrate the camera-projector alignment. In the reported experiments, the teacher often arrived 10-15 minutes before the lesson because an experiment with a research team is not an ordinary event, but in daily routines, they might have another lesson before or simply deserve a coffee break. The room preparation time is also an issue in CSCL when classroom furniture needs to be moved to facilitate teamwork. Even when research is conducted in 'authentic' contexts, short-term interventions inadvertently waive some of the micro-constraints that shape classroom routines, such as:
- Time budget. Teachers often agree, for instance, to spend 90 minutes on the content taught in the experiment, while they usually devote only 60 minutes.
- Latecomers: If a learner arrives 15 minutes late or misses the previous lesson, can they catch up? In experimental settings, they are typically excluded from the dataset. In real life, these learners should receive the same instruction as the rest of the class.
- Time fragmentation: If some learners haven't finished the activities when the bell rings, can they save their work and resume later?
- Traces: Do technology-based activities generate digital or physical traces? Traces support student rehearsal before tests and enable parents to stay informed about their children's actions at school.
- Login: In elementary schools, entering correct passwords can take several minutes. If this burns 5 minutes in a 50-minute lesson, do the security benefits justify a 10% decrease in learning time?
- Discipline: Maintaining some control of the class is a legitimate concern for teachers, especially novices. Control does not mean keeping the class silent but fostering a favorable learning climate: a reasonable level of noise, avoiding off-task drift and social misconduct, etc.
- Assessment: Measuring learning and offering feedback are crucial for effective teaching. Most school systems translate this process into grades and define rules such as assigning five grades per student each semester. In experimental settings, we often avoid grading, namely for ethical reasons.
These details do not appear in methodological handbooks, yet they spoil upscaling. I call them micro-constraints in contrast to 'true' pedagogical constraints in instructional design, such as content structure, prerequisites, diversity, etc. Micro-constraints are not about 'how people learn' but what Nussbaum and Diaz (2013) named the 'logistics of education'. Both researchers and technology developers overlook them.
5. Tackling the myth: experiment 2
The second experiment tackles the myth of intrinsic effects. Like the logistics simulation, we designed an augmented reality environment, which technically refers to overlaying digital elements over real objects or their images. The term 'reality' is indeed misleading. The logistics simulation offers no perceptual fidelity with a real warehouse, only cognitive fidelity. In the real world, reshuffling 30 shelves in 2 minutes with fingers is impossible. The 'augmentation' partly escapes reality, making the impossible possible. This principle inspired an AR for apprentice gardeners (Kim et al., 2020). When facing an empty garden, an experienced gardener visualizes how plants will look in the future. Apprentices lack this experience, but AR can simulate it. After capturing a garden landscape with a drone, apprentices explore it through a virtual reality headset. They place flowers, trees, benches, and more. They then explore and modify the garden as often as needed. In real life, moving a planted tree is more than difficult. Another impossible act becomes possible: time travel, viewing the garden at different times of day, seasons, or in the future (Figure 4, left).
Figure 4. An AR environment for gardener apprentices (left). One of their garden sketches (right)
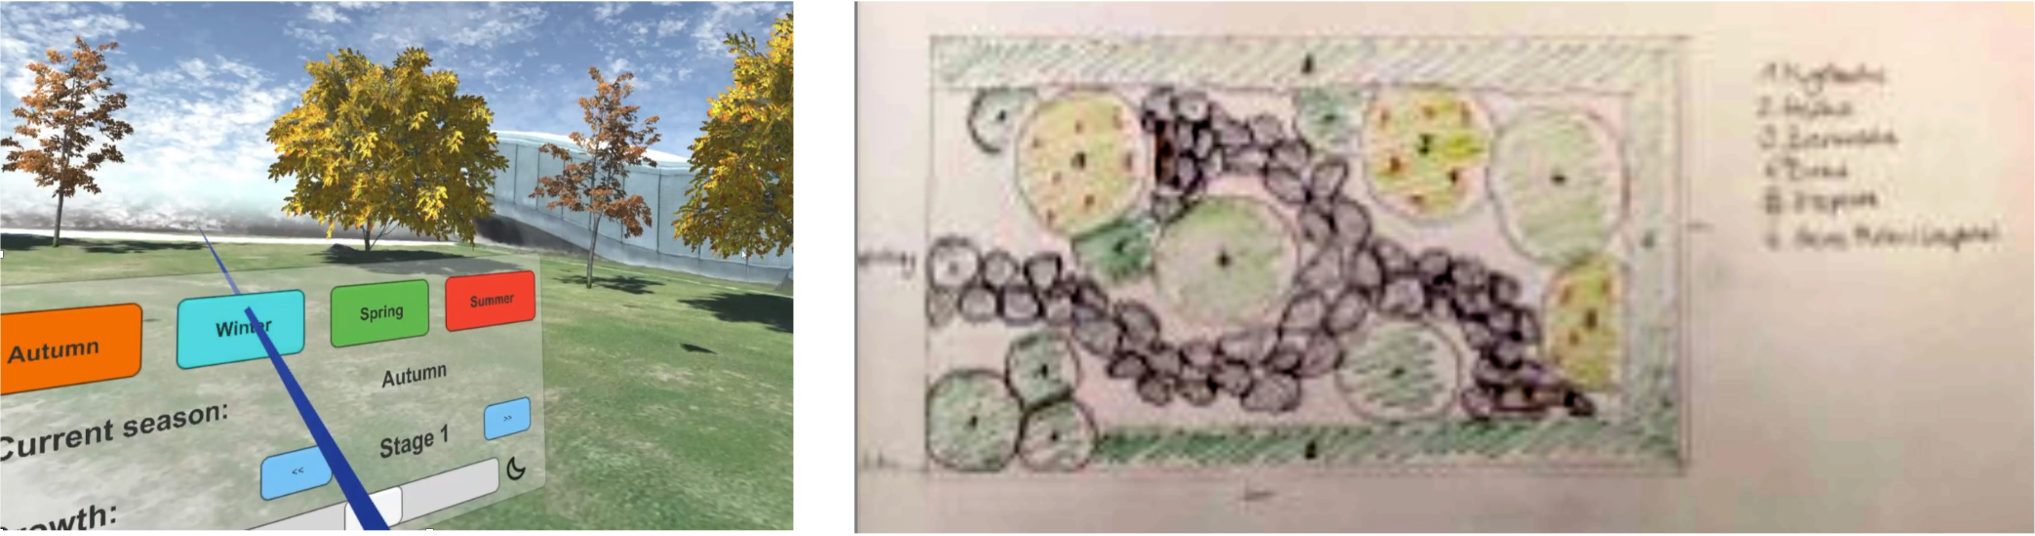
This new experiment did not compare AR to paper activities, but examined their complementarity. In one condition, apprentices sketched a garden on paper (Figure 4, right) before constructing it in 3D. In the other condition, they built it in AR and then sketched it. The results showed significantly better garden designs in proportion and composition when apprentices sketched on paper first (Kim et al., 2020). Sketching encouraged more careful planning and idea development than tinkering with AR features.
Order effects are well known in experimental studies and instructional design. Presenting instances before or after the concept definition switches from induction to deduction, two distinct cognitive processes. When instruction is followed by problem solving (I-PS) or vice versa (PS-I) (Sinha & Kapur, 2021), the PS activity also differs: I-PS uses application exercises, while PS-I entails open problems. The paper-AR and AR-paper sequences produce different outcomes because learners' cognitive activities differ. We highlight this well-known order effect because it challenges the myth of intrinsic effects**: if the technology effectiveness varies depending on what learners did before, it shows the technology has no intrinsic effect**. While this may seem obvious to many, our methods still strive to isolate the effect of the technology activity.
6. 'OR' versus 'AND'
The myth of intrinsic effects originates from a false dichotomy: treating technology-based and non-technological activities as mutually exclusive. "Is A better than B?" is common to our empirical studies, but also among decision-makers and journalists. They asked the same question about Dynamilis, a tablet app that analyzes children's handwriting to identify fine motor difficulties and recommends relevant games (Asselborn et al., 2018; Pasco et al., 2025). Is Dynamilis (A) better than paper(B)? asked decision-makers. This question is natural but irrelevant because it would make no sense to sit a 6-year-old for an entire lesson in front of a tablet. Typically, a teacher would set up four activity stations: one with tablets (A), one for writing in a sandbox (B), another where they write large letters on a peer's back for guessing (C), and a final station for writing on paper (D). Every 15 minutes, students rotate to the next station. This A-B-C-D sequence will not isolate the effect of Dynamilis, but an 'A or B' experiment wouldn't match school reality.
Integrating digital and non-digital activities into a coherent scenario depends not only on teachers' TPACK, but also on the technology design: does it facilitate integration? Many designers have an 'A or B' mindset. Dynamilis recommends digital and paper-based games that learners can download and print. 'Orchestration graphs' (Dillenbourg, 2015) offer a notation for integrating activities. They are placed on a model (Figure 5), with time as the horizontal axis and the social plane as the vertical axis: individual, team, and class activities. Being an early promoter of CSCL, I grew concerned when collaborative learning nearly became unquestioned dogma. These graphs encourage teachers and designers to blend social and individual activities.
Figure 5. The ArgueGraph is based on socio-cognitive conflict (Jermann & Dillenbourg, 2003): 1) introductory lecture, 2) individual questionnaire, 3) an opinion map shows the learners' position computed from their answers, 4) pairs of students who gave conflicting answers answer the same questionnaire, (5) all answers are aggregated and discussed by the teacher.
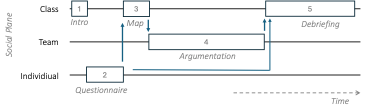
In ArgueGraph, individual responses from activity 2 are compiled into an opinion map for activity 3 and used to form pairs for activity 4. Responses from activities 2 and 4 are aggregated into a dashboard for activity 5. The arrows indicate the flow of data between activities, with some activity's output serving as input for the next. This sequence of data operations is called a workflow, an unusual term in instructional design, but it reduces the teacher time spent on logistics tasks. Section 9 discusses orchestration technologies.
7. The classroom as a (computational) system
A 'classroom blind' technology supports individual or team learning activities while neglecting the classroom context. There would be no reason to coin yet another term, such as 'classroom blind,' unless it conveys a specific message. I believe it does. Classroom dashboards (Schwendimann et al., 2016) do provide teachers with an overview of learners' digital activities, for instance, who is active or struggling, or individuals' progress. Unfortunately, many dashboards are overly complex, creating extra workload for teachers rather than truly helping them. Unless dashboard visualizations are minimalist, expecting teachers to focus on them while managing the classroom is unrealistic. While many studies have described dashboards, few examine their effects, except Do Lenh et al. (2012) and Holstein (2019). The latter measured whether a dashboard led teachers to adjust instruction and whether this influenced learning outcomes. Figure 6 summarizes his findings.
Figure 6. The dashboard enabled teachers to adapt their teaching, which produced higher learning gains (Holstein, 2019).

Contrasting with 'classroom blind' technology, what would a 'classroom aware' technology look like? The concept of 'context-awareness' originally emerged with mobile devices that automatically adapt to changes in users' contexts (Schilit et al., 1994), for instance, their location, the ambient noise, or lighting conditions. In classrooms, users' context refers to the students' and teacher's behavior, even though recent research calls for metrics such as temperature and air quality (Alavi et al., 2022). Other studies described below used classroom context and ambient displays to convey information (Bakker et al., 2012). These two information streams–what is captured and what is conveyed in the classroom–correspond to the input and output of an information system. Describing a 'classroom as a system' (Dillenbourg, 2021) is a tautology: a cell, a foot, or a metro network are all systems, but in learning technologies, 'system' often refers to a rectangular box. Viewing the classroom as a system encourages designers to look beyond the device. A classroom acts as an input device by capturing 'social signals' (Vinciarelli et al., 2008) expected to indicate learning, such as speech, gestures, location, body posture, facial expressions, and gaze direction. A classroom becomes an output device when it delivers information to the class not through individual screens but through surfaces like walls or ceilings. Between the input and output, a system performs transformations such as mirroring, aggregating, comparing, clustering, or predicting. In terms of orchestration planes, most dashboards take input from the individual level and generate output at the class level, but the following examples involve all levels.
- In Racca et al. (2015), two high-resolution cameras monitor students' attention during university lectures. Teachers who lose attention during lectures generally notice it and respond accordingly, though some fail to do so. Measuring attention is challenging because university students learned to fake attentiveness in previous school years. The algorithm found that attention was only predictable collectively: students who turn their heads in sync usually do so because they are following a moving object, their teacher. The input was at the class level, but the output was geared towards the teacher.
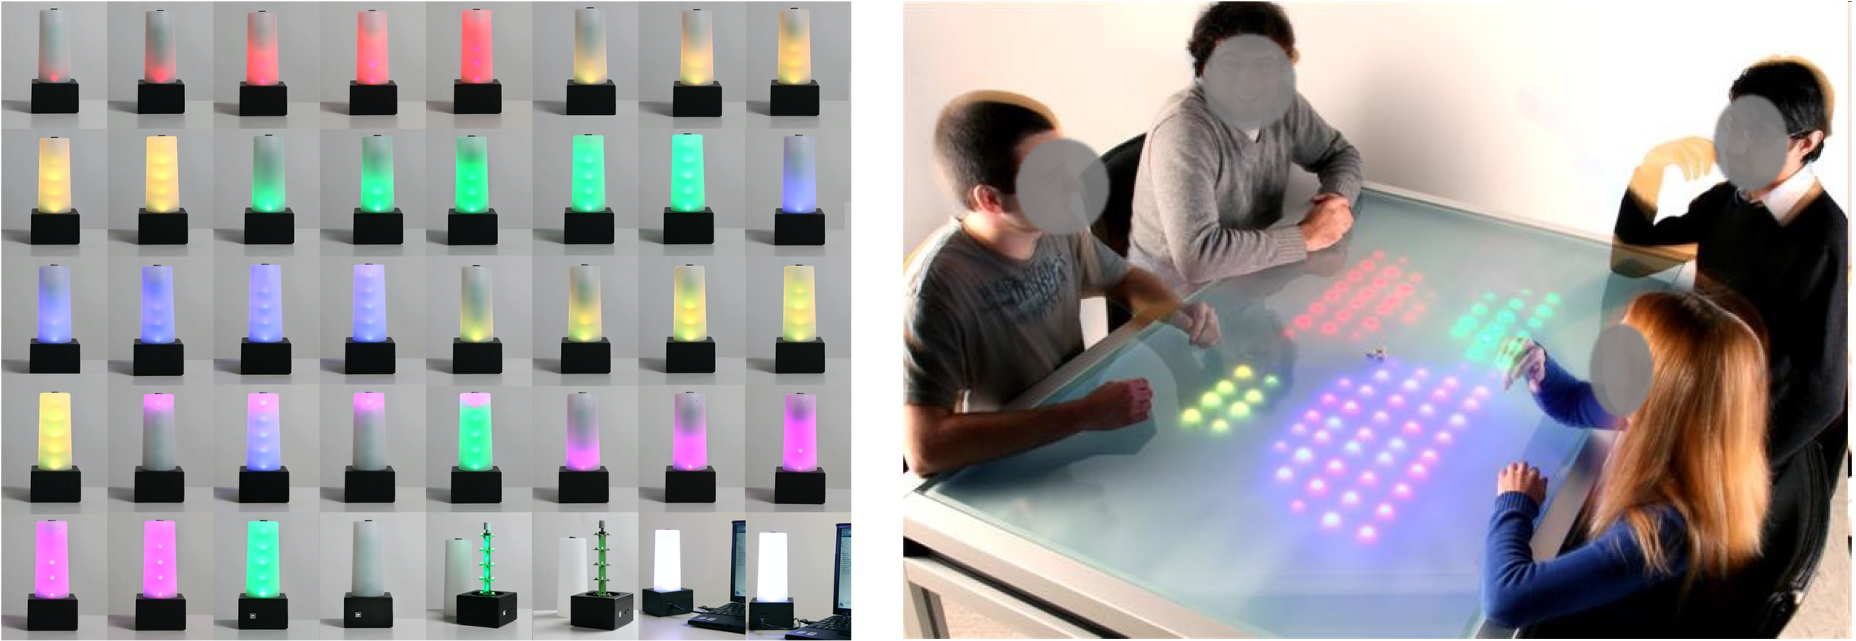
- During exercise sessions, student teams call the teaching assistant for help. We observed that they remain inactive for 62% of the waiting time, trying to catch the assistant's attention instead of working on alternative solutions (Alavi & Dillenbourg, 2011). We therefore designed the Lantern (Figure 7, left) and placed one device on each team's desk. After each exercise, they rotate its cover, which changes color to indicate which problem they are working on. The LEDs light up progressively, showing how long they have been trying to solve the problem. When students need help, they press the cover, causing the Lantern to blink slowly and then more rapidly to indicate the wait time. With this minimalist technology, wasted waiting time dropped from 62% to 6%, as students kept working while waiting. The input is at the team level, while the output is spatially distributed across the classroom space.
- The REFLECT table (Bachour et al., 2010) captures team members' voices using a microphone array that detects the direction of incoming speech. It gradually illuminates LEDs in the area where the speaker is seated (Figure 7, right). The number of lit LEDs indicates the member's percentage of speaking time over a given period. Both input and output occur at the team level. Awareness tools act like mirrors: they reflect an image back to the team to support self-regulation. REFLECT reduced unbalanced participation, but empirical research on group awareness tools has shown mixed results (Bodemer & Dehler, 2011; Strauss & Rummel, 2020; Theophilou et al., 2024). Here, the input and the output are at the team level.
- The teacher's behavior belongs to classroom-level inputs: how much does he or she speak, does he or she ask questions to all learners, does he or she move around the classroom, and is visual attention distributed among students? Sümer et al. (2018) provided teachers with mobile eye trackers to generate attention maps, while Lim et al. (2012) recorded teachers' positions. Technology may produce classroom heat maps showing teachers' gaze or physical location. Projects have focused on analyzing the teacher's speech, such as the proportion of teacher talk versus student talk, and, with AI, extracting the topics of their utterances (Kronholm et al., 2017) or their dialogue strategies (e.g., re-voicing a student's utterance) (Suresh et al., 2019). These 'tools' should be used as temporary prostheses for teacher professional development. They have a 'quantum-like' feature: what is observed changes simply by the act of observation; Nápoles & Vázquez-Ramos (2013) asked teachers to estimate their teaching time, then count their actual speaking time from a video recording, and then teach again. In the second session, their speaking time was reduced by about half.
Figure 7: The Lantern (left) and the Reflect Table (right)
Of course, capturing classroom signals raises data protection issues. Are the risks taken by those who accept (or are forced to) have their signals collected counterbalanced by the benefits this information is supposed to bring to them? The hypothetical benefits occur if the system output influences learners' or teachers' behavior in a way that improves learning. As mentioned, evidence supporting this hypothesis is scarce, except for the Holstein study and the logistics study. The risks scale with the level of output. Within the classroom, everyone likely perceives the same signals as the system. Nonetheless, making individual weaknesses more explicit or pointing out a shy participant (Reflect Table) is not harmless. In the attention measures described above, we could design cameras that do not store images but compute the head co-rotation index in real time, but we stopped this line of research because the work could be misappropriated.
8. Orchestrable technologies
Tchounikine (2013) distinguished between orchestration technologies, which assist teachers in their orchestration tasks, and orchestrability, which refers to technologies that are easy to orchestrate. 'Orchestrable' somehow means the opposite of 'classroom-blind'. Orchestrability features (Dillenbourg & Jermann, 2010) pertain to the classroom micro-constraints. Here are some examples:
- Flexibility: Can teachers adjust technology-based activities on the fly? Technical limitations often hinder modifications to the lesson plan, such as shortening, skipping, or reordering activities.
- Empowering: Does the technology enable teachers to drive activities? For example, the appeal of logistics AR made it challenging for teachers to capture learners' attention when needed. Empowering does not mean lecturing, but constructivism does not mean "teacherless". The teacher must guide learners, challenge them, and lead debriefing activities.
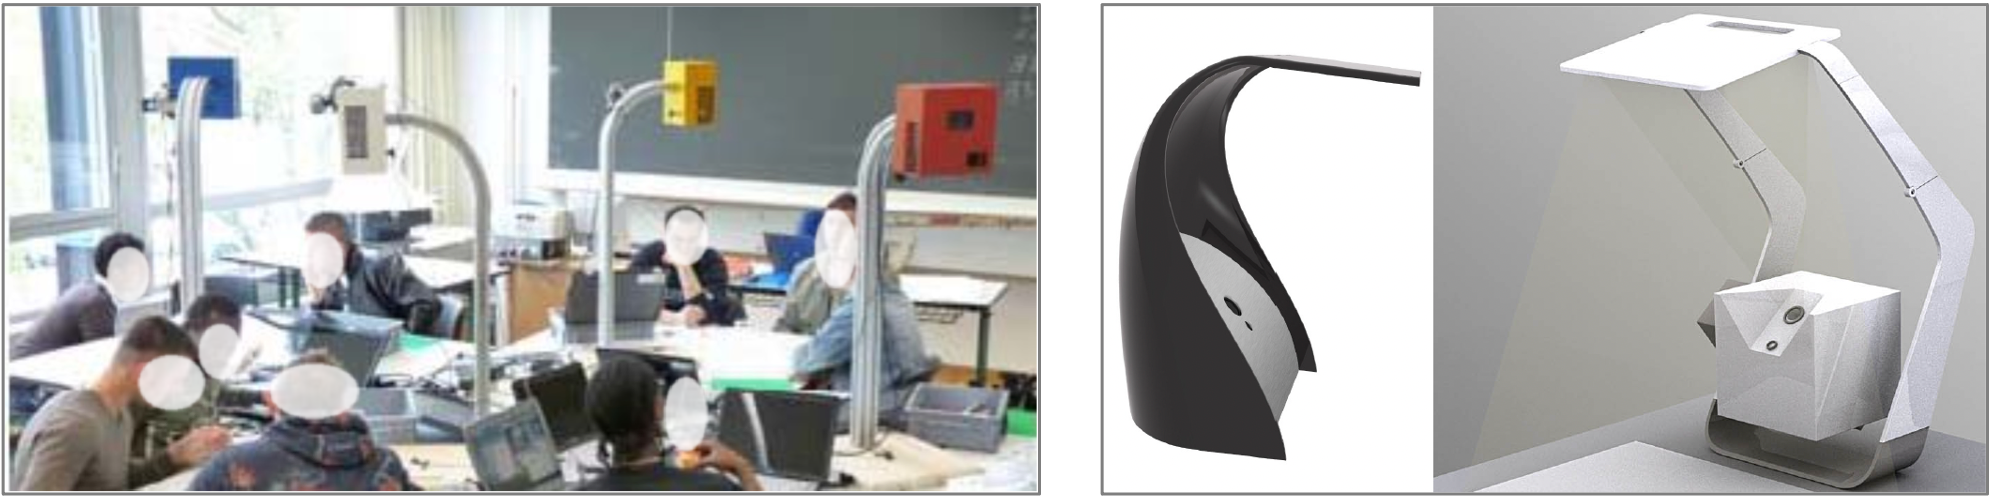
- Visibility: Does the technology hinder teachers from observing what learners are doing? Responsible teachers must monitor learners' behavior. Tangible interfaces provide this visibility, but some devices hide students, such as the black AR device shown on the right in Figure 8, compared with the white one on the left.
- Minimalism: Are technological features overwhelming? For teachers busy with orchestration, simpler interfaces are better. We described them as 'modest computing' (Alavi & Dillenbourg, 2011), emphasizing the intentional reduction of resolution in peripheral awareness tools like the Lantern or the REFLECT.
Within the 'classroom as a system' metaphor, orchestrability can be reformulated as classroom usability. In HCI, usability usually refers to how easily users interact with a digital environment. The logistics tangible interface, for instance, affords faster shelf manipulation than a multi-touch table (Lucchi et al., 2010). Individual usability constitutes the first circle of usability (Alavi & Dillenbourg, 2011). In the second circle, the user is a team. Does the interface, for instance, afford deictic references in collaborative tasks (Pinelle et al., 2003), which are critical for disambiguating conversations and building a shared understanding (Roschelle, 1992)? The 'user' of the third circle is the classroom: how easily can the classroom process be orchestrated? In Figure 8 (left), each device has a different color. This neither modifies individual (level 1) nor team usability (level 2) but facilitates orchestration (level 3) by enabling the teacher to refer to each team by the color of its device. These three usability circles correspond to the social planes of orchestration graphs. High usability in one circle does not compensate for poor usability in the others; all three must be satisfactory for a teacher to say, "it works well in my class".
Figure 8. The color of devices as classroom usability (left), the device design changes visibility of learners (right)
9. Orchestration technologies
Orchestration technologies aim to facilitate classroom orchestration, including monitoring, intervention, time management, managing transitions, team formation, and debriefing.
Monitoring and intervention are supported by dashboards, mostly centralized displays, but Lanterns are a spatially distributed dashboard. Dashboards compensate for the low visibility of activities that happen on personal devices. Dashboards may support teachers' interventions by summarizing students' work (Shahmoradi et al., 2024). Dashboards should avoid overloading teachers while still supporting their tasks.
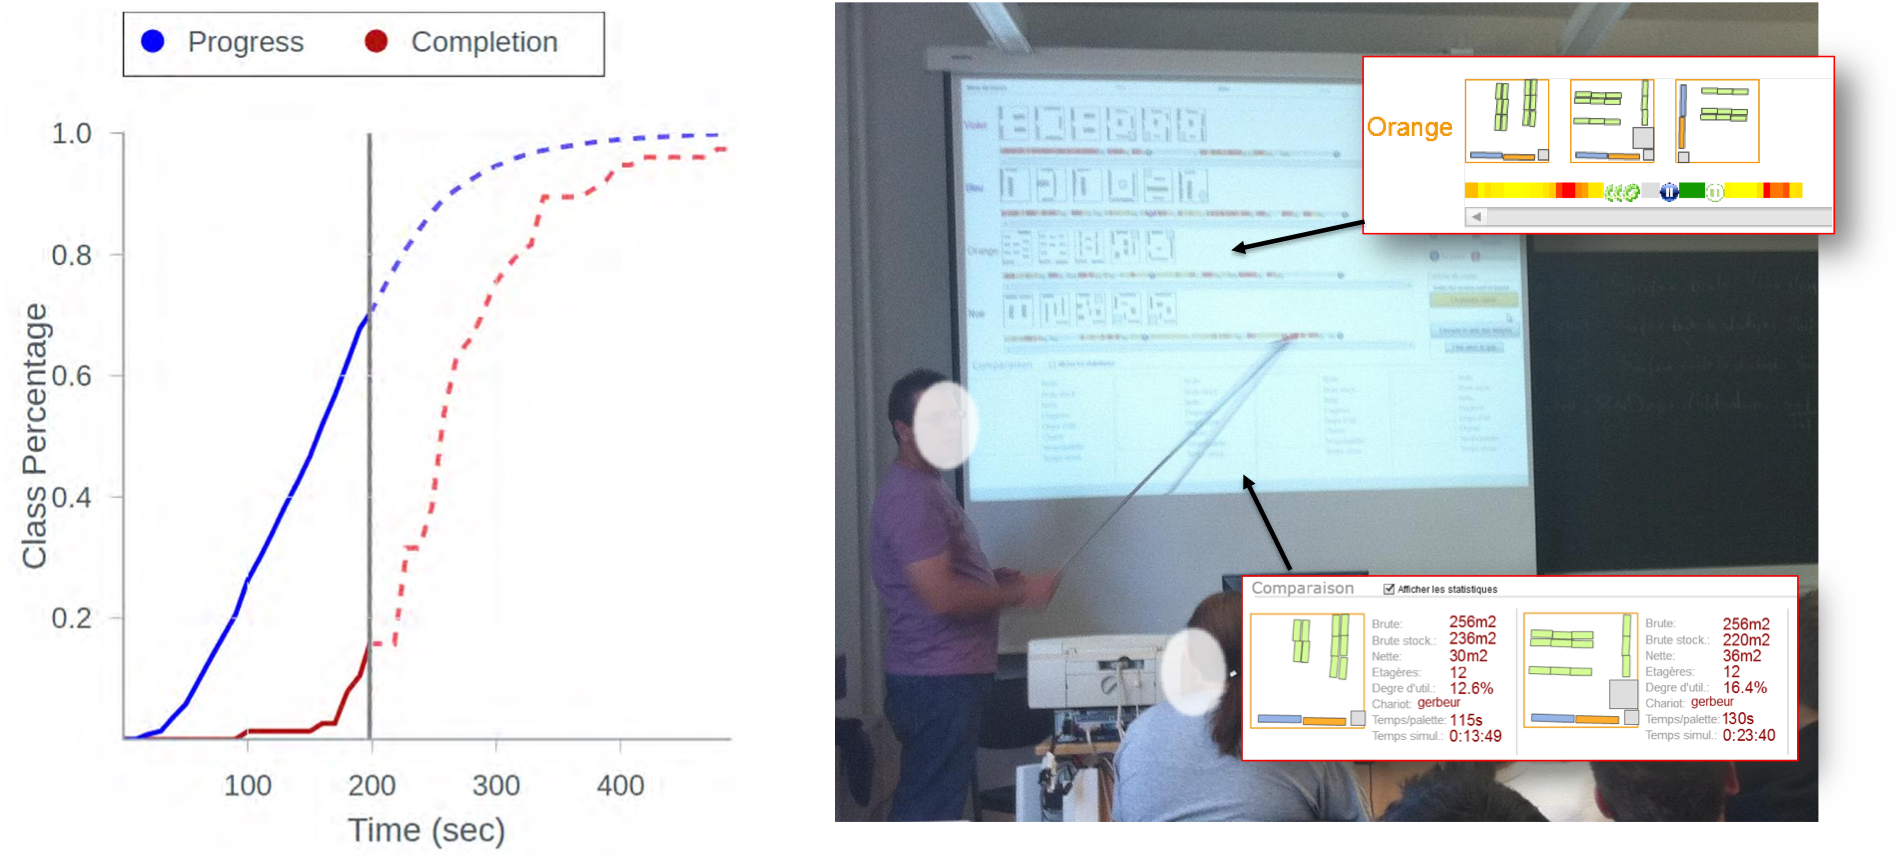
Time management and transitions between activities can be challenging, especially during social plane shifts, when everyone must finish before the team activity begins (Olsen et al., 2021). In ArgueGraph, teachers had to wait for late finishers on the individual questionnaire to form pairs for the argumentation phase. This raised a dilemma: wait for a few students or waste class time? Faucon et al. (2020) built an orchestration widget that predicts students' progress in real time (Figure 9, left). Time is on the X-axis, with blue and red curves indicating the percentage of students who have started or completed their tasks, respectively. The solid lines show live data, while the dotted lines show predictions. When the lines flatten, waiting longer is unlikely to increase the number of completers; hence, the teacher could proceed.
Team Formation. Learners often form teams by choosing their own groups, but teams should sometimes be structured to minimize or maximize differences among members based on skills, backgrounds, genre, language, nationality, or other criteria (Borges et al., 2018).In the ArgueGraph workflow (Figure 5), an orchestration tool forms pairs of learners with contrasting opinions. As the teacher, I could manually handle this process for a class of 20 to 30 learners. However, for larger classes of 100 or more students, a computer algorithm was necessary to maximize the average opinion difference between peers.
Debriefing is the craft of articulating what learners have done during a problem-solving activity and the knowledge expected to be inferred. Reflection and abstraction are required for turning experience into learning, but they are not spontaneous. The teachers' role is to trigger them. Typically, they ask learners to report their attempts, to explain and compare their solutions, and relate them to the concepts or principles to be learned. Schwartz and Bransford (1998) captured this with the slogan 'a time for telling': 'telling' before problem solving is less effective than the other way around (Sinha & Kapur, 2021), but problem solving without 'telling' is not enough. Debriefing is demanding for teachers because building on what learners produce, which is hard to anticipate, involves a degree of improvisation. The dashboard used for logistics activities (Figure 9, right) supported real-time monitoring and debriefing. The upper part shows the warehouse layouts built over time. The yellow-to-red bar indicates how much the team was 'tinkering': red indicates too many shelf manipulations, prompting the teacher to push reflection. In the lower part, the teacher could compare two layouts on logistics variables such as row and net surface or performance. These comparisons articulated layout features and performance, revealing logistics principles.
Figure 9. Visualization for timing a plane transition (left) and dashboard for monitoring and debriefing (right).
10. Spinach in the conclusions
This contribution articulated several factors behind the poor replicability of experimental findings: classroom micro-constraints, classroom blindness, classroom usability, orchestration, and orchestrability. These factors are all related to the myth of technology's intrinsic effects: why should we care about teachers or school constraints if the effect of technology is independent of the context? The experiments with gardeners and logisticians should have shaken this myth: learning outcomes changed with context while the technology stayed the same. Technology has no intrinsic effect on learning. However, myths survive evidence. The term 'myth' may be overloaded, but this unshakeable belief reminds us of the story of spinach's effects on health. A century ago, the iron quantity in spinach was exaggerated tenfold because of a decimal-point error, vastly overstating its nutritional value. Spinach does not contain more iron than many other vegetables (Sutton, 2016). I know this, but because my mother and Popeye reinforced this false belief over the years, I still associate the feeling of iron with eating spinach. Like for spinach, most researchers would agree that technology has no intrinsic effects. Yet, choosing technology as an independent variable reveals the syndrome. This 'Spinach of Intrinsic Technology Effects' (SITE) syndrome still appears in meta-analysis titles such as 'the effects of learning technologies'.
For researchers, the takeaway is not abandoning RCT methods. Some issues can be mitigated by conducting larger RCTs, with more school diversity (randomizing contextual variables), or longer durations (micro-constraints can't be waived for long). An alternative is to treat classroom features as independent variables while keeping the technology constant. In our SITE-affected experiments, technology was the independent variable, mea culpa, but results showed that the teacher's role and activity sequence are more than moderating variables.
Decision makers, such as school directors or policymakers, are unlikely to read lengthy papers. Yet we still have a duty to communicate with them. A starting point is to address the 'OR' versus 'AND' mindset. We should also challenge another misconception: that 'new learning technologies' are innovative per se. First, digital tools are not new technologies; 'new' seems to mean 'not used in my grandfather's school'. Second, something new isn't necessarily an innovation. Although the tools shown in this paper enable novel learning activities, their development was not driven by a quest for innovation but by addressing school problems such as unbalanced teamwork, wasted time during exercises, or challenges in teaching logistics.
The implication for designers is to anticipate how their technology fits into the classroom ecosystem and facilitate orchestration. We suggest features for shifting from 'classroom-blind' to 'classroom-aware' design. While learner-centric design is common, we emphasize teacher features. The point is not to choose between teachers OR learners; both are to be factored in. Teacher features include peripheral awareness, minimalism, modest computing, and integrating digital and paper formats. Classroom routines have used paper for decades. Sheets are easy to distribute, collect, share, annotate, rotate, fold, or cut (Bonnard et al., 2012), and AI enables paper sketches and notes to be seamlessly incorporated into digital workflows.
Acknowledgments
This paper was written during a residency at the Paris Institute for Advanced Study in May 2026. I am grateful to the staff for creating a creative academic environment. The work has been carried out with Patrick Jermann, Hamed Alavi, Son Do Lenh, Guillaume Zufferey, Khaled Bachour, Quentin Bonnard, Frédéric Kaplan, Olivier Guédat, Luis Prieto, Kshitij Sharma, Lucasz Kidzinsky, Sina Shahmoradi, Barbara Bruno, Aditi Kothiyal, Thibault Asselborn, Wafa Johal, Kevin Gonyop Kim, Jenny Olsen, Mirko Raca, Luis Faucon, Sébastien Cuendet, Himanshu Verma, Daniel Caballero, Richard Davis, and many other lab members. Numerous discussions with Manu Kapur, Miguel Nüssbam, Pierre Tchoukinine, Ulrich Hoppe, Alberto Cattaneo, Jeremy Roschelle, Frank Fischer, and colleagues worldwide enriched these ideas. I am grateful to the teachers, directors, and learners who participated in experiments in public and private schools. SNSF, SBFI, EU H2020, and EPFL funded this work.